Finances · Part 4 of 4
Real taxes, less hearsay
My simulator's flat 5% tax knob was hearsay. A real tax engine measured 22%, the knob went to 15%, and asset location beat every Roth conversion video.
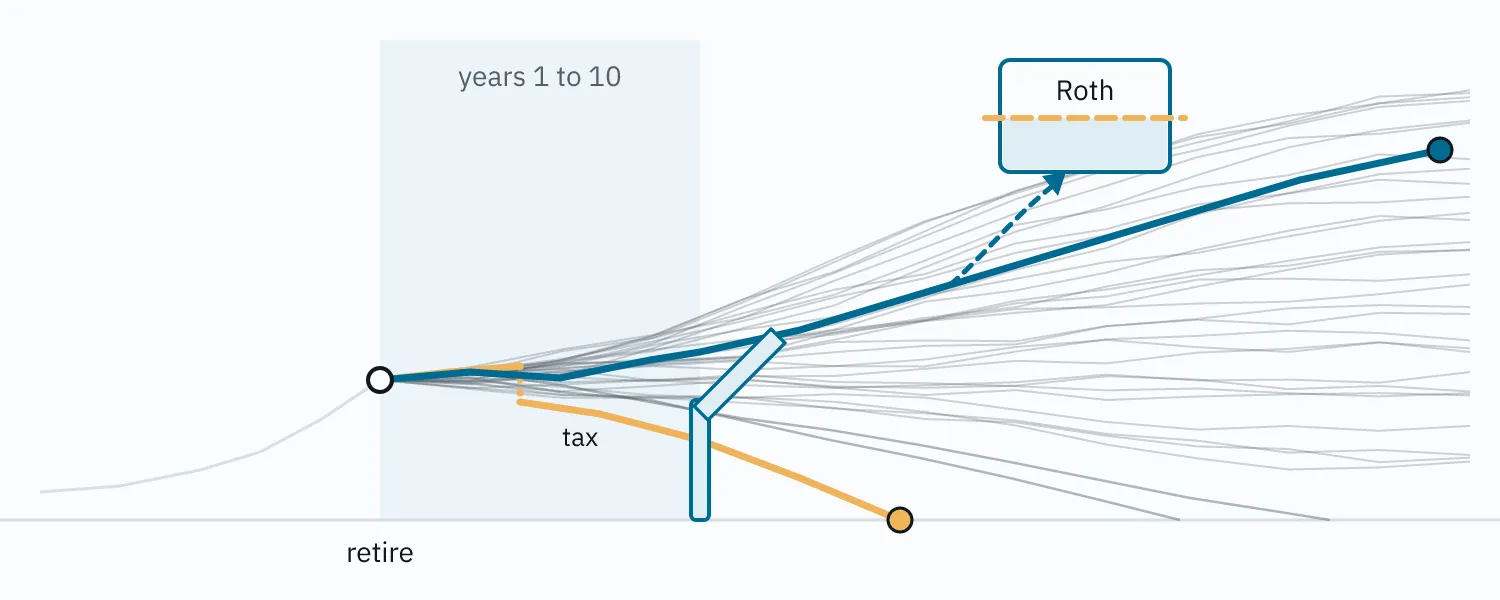
On this page
My retirement simulator taxed every withdrawal at a flat 5%. The number came from YouTube: spend the brokerage account first, convert to Roth while your income is low, stay under the health-insurance subsidy cliff, and the effective tax rate on your withdrawals lands in single digits. At the time, that 5% moved the earliest safe retirement age a full year earlier, and two videos got the catalog’s top score for recommending it. Nobody could check it, because the engine could not see accounts. It saw one pile of money and one number.
This post is about what happened when the simulator got an instrument that could check: a real tax engine. The real lifetime rate turned out to be 22%. The knob still went to 15%, not 22%, because the bill is back-loaded. The early retirement years, the ones that decide whether a bad start year survives, run at about 12%, and 15% is the flat rate that reproduces the real engine’s failed start years. At 15% the video scoreboard moved. The first post in this series explains the historical-replay engine, the second the video-vetting pipeline whose scores this round revised, and the third what sequence risk looks like in one life.
Nine terms the videos throw around
- Pre-tax vs Roth. A pre-tax 401k or traditional IRA is funded with untaxed wages, and every dollar that comes out later is ordinary income. A Roth account is funded with taxed wages, and withdrawals are tax-free once you are past 59½ and the account is old enough. This household’s savings are mostly pre-tax.
- Brokerage and cost basis. An ordinary investment account. You are taxed only on the gain when you sell: sale price minus what you paid (the basis). Long-term gains have their own lower rate schedule, with a 0% band at low incomes.
- Brackets. Income above the standard deduction is taxed in slices at rising rates: 10%, 12%, 22%, 24% and up. “Filling the 22% bracket” means creating income until you reach the top of that slice.
- MAGI and its two thresholds. Modified adjusted gross income is the figure federal programs test. Before Medicare, the health-insurance premium credit (the ACA subsidy) vanishes above a MAGI cliff at four times the poverty line, a hard cliff again since the enhanced credits expired at the end of 2025. From 65, Medicare premiums jump two years after MAGI crosses the first IRMAA tier. Pre-tax withdrawals raise MAGI; Roth withdrawals do not.
- RMDs. Required minimum distributions. From age 75 (for anyone born after 1959) the law forces a rising share of pre-tax accounts out each year as taxable income, whether or not you need the money.
- Rule of 55. Leave an employer in or after the year you turn 55 and that employer’s 401k can be drawn before 59½ without the 10% early-withdrawal penalty. Leave at 54 and it cannot.
- Roth conversion. Moving pre-tax dollars into a Roth account and paying income tax on them now, so they and their growth are never taxed again. The tax is paid out of the portfolio.
- Asset location. Choosing which account holds which asset while the household’s overall mix stays the same. The version tested here puts fixed income in the pre-tax accounts first and stock in Roth and brokerage.
- Cohort. One replay of the household’s life using the actual returns and inflation that began in a given historical year, 1928 through 2025. Ninety-eight of them. A “lost cohort” is a start year that runs out of money.
The instrument#
The old engine had one knob, “effective tax on withdrawals”. Every outside claim about Roth conversions, withdrawal order or the subsidy cliff collapsed into “turn the knob down and see what happens”. Allocation questions were settled properly, cohort by cohort. Tax questions were not, and the 5% setting was the result: a number nobody had measured, doing a full year of work on the retirement frontier.
The plan engine tracks nine account types, each with its own balance, cost basis and access rules, and computes the household’s real federal bill every year. Withdrawals, tax, the ACA credit and the IRMAA surcharge all depend on each other through MAGI, so it solves them together in a fixed-point loop until they agree. A policy is one rule from each of four dimensions: how to contribute while working, whether and how far to convert, which account pays for spending, and which account holds which asset. Policies are rows in a JSON catalog; the engine changes only when a row needs a rule it lacks. It replays the same 98 historical start years as the rest of the simulator, and its verdicts are read the same way: as a list of failed start years, not a success percentage. “Lost 1965” (the classic inflation start) is a different finding from “lost 1929”.
The real bill: twenty-odd percent, back-loaded#
With every draw going through the bracket math, the engine can measure what the knob only guessed. The metric: the tax caused by every dollar that leaves a retirement account, forced or chosen, divided by the dollars actually drawn to pay for spending, summed over each history’s retired years and taken as the median across the 98 histories. The denominator matters. The flat knob only ever taxed spending draws, so the number that replaces it has to carry the whole bill on that base, including the tax on required distributions the household did not need.
| Ages | Retire at 55 | Retire at 54 |
|---|---|---|
| before 55 | n/a | 1% |
| 55 to 59 | 12% | 21% |
| 60 to 64 | 14% | 14% |
| 65 to 74 | 15% | 15% |
| 75 and on | 31% | 31% |
| lifetime | 22% | 23% |
Three things fall out of that chart. The 5% was not a little optimistic; the lifetime figure is off by a factor of four. The 75-and-on band is the surprise, not because the bracket is high but because by then Social Security covers most of the spending, so the tax on forced distributions lands on a small base. And the axis that matters is not age but the rule of 55: the 55-to-59 band is the only place the two columns differ, and it differs by nine points.
So the knob has to be calibrated to what it is for, which is survival. Sweeping it on the old engine against the plan engine’s failed start years: 5% and 10% were never right. 5% passed retirement at 54 with 97% of start years on the flat engine, while the real engine lost between a quarter and a third of them. At 55, 12% is a cohort too rosy, 15% reproduces the real engine within a cohort and errs on the safe side, 18% is six cohorts too harsh, and 20% moves the frontier a year later. The knob went to 15%. The 5% it replaced was ten points of hearsay.
Re-scoring the YouTube videos at 15%#
With the knob honest, every tax claim the video pipeline had shelved as untestable became a policy row. Each is a pair of rows that differ in exactly one dimension: same allocation, same spending, same 98 histories, retire 55 with Social Security at 65. The baseline (max every tax-advantaged contribution, never convert, spend brokerage first and Roth last) loses three Depression start years, 1928, 1929 and 1936, and so does every sane policy. Each verdict below is what a row does beyond that.
“Convert as soon as you retire, while income is low.” Two videos held the catalog’s top mark for this. Converting from day one up to the first IRMAA tier loses one cohort (1965) for a 13% lifetime-tax saving, and the worst ruin age falls from 85 to 82. To the top of the 22% bracket, two cohorts (1961 and 1965). To the top of the 24% bracket, seven, and the worst ruin age falls nine years. The same IRMAA ceiling applied only after ten retirement years, and only in years the portfolio is at least 25 times spending, keeps every cohort and still cuts lifetime tax 11%. Both videos dropped to a one: the lever is real, the timing is wrong.
“Stop contributing pre-tax at the sweet spot.” Defer only what the employer matches, send the rest to brokerage. It loses a cohort and adds 30% lifetime tax; the working-year saving on the deferral beats the RMD it creates later. That video went to minus one.
“The Roth mistake is drawing Roth first.” Confirmed. The baseline order (brokerage first, Roth last) beats spending pre-tax first, which loses two cohorts and 8% of median wealth. Up to a one.
“Do the mega-backdoor.” Confirmed. Contributing after-tax dollars beyond the 401k limit and converting them to Roth immediately, versus sending the same dollars to brokerage: the brokerage version loses two cohorts (1935 and 1965) and pays 22% more lifetime tax. Up to a one. One caveat the engine surfaced: this only holds because the household already maxes the pre-tax deferral. The mega-backdoor is the next dollar, not a replacement for the first one.
“Elect Roth for the whole 401k.” No, on survival. Paying the marginal rate out of the portfolio in every working year costs the same two cohorts, even though lifetime tax falls a quarter and heir value rises.
“Manage MAGI for the subsidy” and “harvest gains in the 0% band.” Both describe a household with a large taxable account and low ordinary income, which a saver who maxed pre-tax for decades is not. The subsidy bridge loses a cohort and adds 30% lifetime tax for a small credit. Harvesting is byte-identical to baseline: brokerage is spent inside the first two retirement years, and rule-of-55 draws put taxable income far above the 0% band every year after. There is never a dollar of room.
| Policy | Cohorts lost vs baseline | Lifetime tax vs baseline | Worst ruin age |
|---|---|---|---|
| convert day one to IRMAA tier | 1 (1965) | -13% | 82 |
| convert day one to 22% top | 2 (1961, 1965) | -25% | 81 |
| convert day one to 24% top | 7 | -38% | 76 |
| convert after window, gated, to IRMAA tier | 0 | -11% | 85 |
| Roth 401k deferral | 2 (1935, 1965) | -25% | 84 |
| skip mega-backdoor | 2 (1935, 1965) | +22% | 85 |
| spend pre-tax first | 2 (1935, 1965) | -6% | 82 |
| chase ACA subsidy | 1 (1965) | +30% | 85 |
| contribute to the match only | 1 (1965) | +30% | 85 |
The pattern across the rows: every Roth move trades survival for tax in the same direction. Pay tax now out of the portfolio, get a lower lifetime bill and a bigger estate later. The one Roth move that was free on survival was the one that waited until the portfolio had already proven it would survive. Six scores moved, fourteen more videos had their “untested, plausible” tags resolved into concrete right and wrong tags, and “convert as soon as you retire” moved to the catalog’s wrong-but-believed list.
| Policy | Failed start years |
|---|---|
| baseline | 1928, 1929, 1936 |
| convert day one to IRMAA tier | 1928, 1929, 1936, 1965 |
| convert day one to 22% top | 1928, 1929, 1936, 1961, 1965 |
| convert day one to 24% top | 1928, 1929, 1935, 1936, 1938, 1939, 1961, 1965, 1973, 1999 |
| convert after window, gated | 1928, 1929, 1936 |
| Roth 401k deferral | 1928, 1929, 1935, 1936, 1965 |
| skip mega-backdoor | 1928, 1929, 1935, 1936, 1965 |
| spend pre-tax first | 1928, 1929, 1935, 1936, 1965 |
| chase ACA subsidy | 1928, 1929, 1936, 1965 |
| harvest 0% gains | 1928, 1929, 1936 |
Asset location beat every conversion rule#
Every policy above changes what the household contributes, converts or spends. The fourth dimension, which account holds which asset, is the one no video in the catalog mentions. The rule tested here keeps the household’s overall mix exactly as it is and only moves sleeves between accounts: fixed income goes into the pre-tax accounts first, stock into Roth and brokerage, and whatever does not fit spills into the room that is left. Pre-tax accounts are taxed in full on the way out, so they hold the assets that grow slowest; Roth grows tax-free, so it holds the assets that grow fastest.
These rows are the current data, re-run for this section, where the household has more margin than in the charts above and no policy loses a start year at 55. Retire 55, same survival everywhere:
| Policy | Median terminal | Lifetime tax |
|---|---|---|
| Fixed income in pre-tax, stock in Roth and brokerage | +10% | −46% |
| Convert to the top of the 22% bracket every year from day one | −0.3% | −43% |
| The gated after-window conversion | +1% | −26% |
The first two rows land close together on tax because they pull the same lever, the size of the pre-tax pile at RMD age, by different routes. Conversion drains the pile by moving dollars out and paying ordinary tax now. Location starves it by keeping the slowest assets in the account that is taxed on exit and the fastest where growth is tax-free. Draining costs tax up front, so the conversion row gives back the median. Starving is free. Stacking the 22% conversion on top of location cuts tax six more points and gives back seven points of median; stacking the gated rule gives back ten points of the tax cut and six of median. With location in place, every conversion costs this household median.
At 54, where the baseline still loses 1935 and 1936, the same trade shows its other face. The day-one 22% conversion loses 1961 as well and the worst ruin age drops from 86 to 82, for a 49% tax cut and a 7% higher median. Location loses nothing, keeps the ruin age, adds 13% to the median and cuts lifetime tax 27%. Every conversion video says “convert”. None says “locate first”.
What survived#
Optional tax paid out of the portfolio in the first decade costs cohorts when survival is marginal and is a tax-for-median trade when it is not. Asset location gets its lifetime-tax cut without paying any tax up front, and it has never cost a start year.
- Right mechanism, wrong household is the common verdict. Harvesting, the subsidy bridge and the sweet-spot rule all describe a household with a big taxable account and low ordinary income. Most tax advice is not written for a pre-tax-heavy saver, and the scores reflect that.
- A flat knob can only tell you the ceiling. Zero tax was a real upper bound on what coordination could buy. It said nothing about whether any sequence of legal moves reached it. For this household none does inside the window, and 5% was never within reach.
- Define the denominator before you trust a rate. The rate that describes the bill is every dollar of tax the accounts cause over the dollars drawn to pay for spending. And even then the bill is not the knob: a flat rate is calibrated to the survival it has to reproduce.
What the engine approximates
The plan engine makes a handful of deliberate simplifications, each marked in the source. The ones a careful reader would want to know about:
- Taxable Social Security follows the IRS provisional-income worksheet, with its never-indexed 1984 and 1993 thresholds deflated in real dollars; the sizing of conversions and bracket-fill draws still assumes the 85% upper bound, so those rules run slightly conservative.
- Taxpayers 65 and over get the additional standard deduction per spouse; the temporary 2025 to 2028 senior deduction is not modelled.
- HSA-qualified spending is derived per year from the medical line, a 60% share of Medicare-phase premiums (Part B and D, not Medigap) and events flagged as medical; unused room does not carry forward.
- Cash flows are start-of-year, the conservative side (a mid-year convention would be worth about one cohort per policy). Penalty-free access at 59½ is approximated as the calendar year of the 60th birthday.
- The early-withdrawal penalty is a flat 10%, including on HSA draws (really 20% for a non-medical draw before 65).
- Unneeded required distributions are reinvested in brokerage at full basis.
- Heir value discounts inherited pre-tax and HSA dollars at a flat 24%.
- The after-window conversion gates are fixed constants (10 years, 25 times spending), not optimized.
- Brackets, limits and gain bands are treated as real-dollar constants because the IRS indexes them; cost basis and conversion lots are nominal and deflate each year.
- Where a traditional IRA’s after-tax basis or the HSA-qualified share of premiums is not in the dataset, the run assumes zero and 60% respectively and stamps the assumption on its output.
- Every verdict is under current tax law. Under a stress regime (brackets 20% narrower, rates five points higher) the gated conversion rule still loses no cohort, still cuts lifetime tax 11% and lands within 1% of the baseline’s median.