Finances · Part 3 of 4
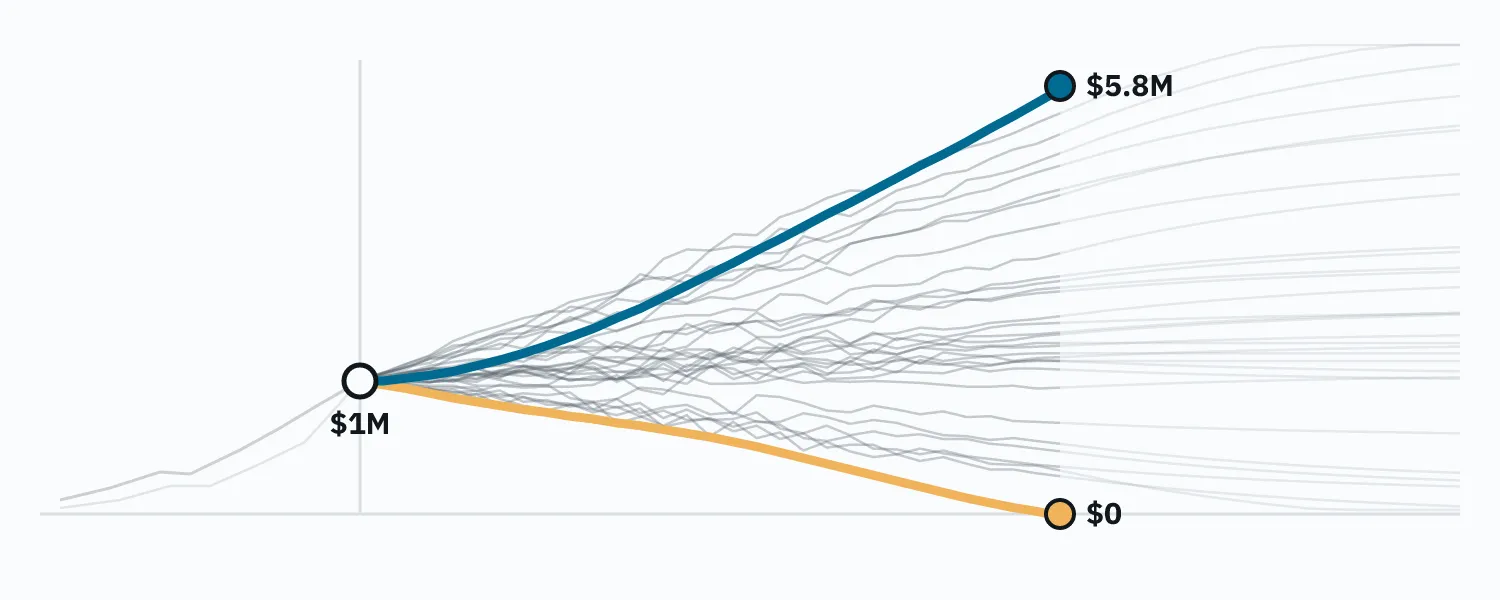
Same plan, same spending. Broke, or $5.8 million.
One textbook retirement plan replayed across 98 historical start years, from 1928 on. Four of those lives, and what sequence-of-returns risk really means.
On this page
Here is a household. It has $1,000,000. It retires at 65, spends $40,000 a year (the textbook 4%) adjusted for inflation every year, holds a 60/40 stock/bond index portfolio, rebalances annually, and needs the money to last thirty years. No Social Security, no pension, no house, no kids, no taxes, no fees. The most boring retirement plan it is possible to write down.
Now run that exact household (same dollars, same spending, same portfolio, same rules) ninety-eight times, once for every year since 1928 it could have retired into, using what stocks, bonds and inflation actually did next. That’s what my simulator does: instead of rolling random returns, it replays every historical start year in order, one full life each, and reports the results in today’s dollars.
Four of those ninety-eight lives, all in today’s dollars#
| Years in | Retire 1929 | Retire 1966 | Retire 1982 | Retire 2000 |
|---|---|---|---|---|
| 0 | $1,000k | $1,000k | $1,000k | $1,000k |
| 5 | $800k | $875k | $1,600k | $815k |
| 10 | $900k | $612k | $2,200k | $690k |
| 15 | n/a | $319k | $3,500k | $740k |
| 20 | ≈$520k | $291k | n/a | $870k |
| 25 | n/a | $156k | n/a | n/a |
| 30 | $690k | $0 | $5,800k | ≈$740k |
Retire in 1929. The worst possible timing, on paper: the market loses most of its value in the first three years, then the Depression, then a world war. And yet the first decade barely hurts: prices are falling, so the $40k gets cheaper to fund every year and the bonds hold up; the portfolio is still at $800k in 1934 and $900k in 1939. The one real scare comes late, when the postwar inflation of the late 1940s bites and the balance sags to about $520k around 1949. Then it recovers. This household dies in 1959 with $690,000, a comfortable retirement that began in the single worst year of the century.
Retire in 1966. Nothing dramatic ever happens. Stocks go sideways for a decade and a half; inflation goes 3, 5, 6, 11, 9, 13 percent. Year by year the withdrawals get bigger in nominal terms and the portfolio doesn’t. It’s $875k in 1971 (fine), then $612k in 1976 (hm), then $319k in 1981, and now the math is obvious to anyone who does it. The great bull market finally arrives in 1982 and it doesn’t matter, because there’s too little left to ride it: $291k in 1986, $156k in 1991, and the account hits zero in 1996, at age 94, in the last year of the plan. Two decades of watching it come.
Retire in 1982. Sixteen years after that household, and same everything. Inflation is finally breaking, and stocks and bonds both take off. It’s $1.6 million by 1987, $2.2 million by 1992, $3.5 million by 1997; the dot-com bust and 2008 are dents in a line going up. This household dies in 2012 with $5.8 million, five times what it started with, after taking $40k out every year for thirty years. It never had a worried moment.
Retire in 2000. The dot-com top; a decade of nothing follows. Down to $815k by 2005, $690k by 2010, and it feels like the 1966 story is starting again. But the inflation never shows up, so the withdrawals stay cheap, and the balance just goes flat: $740k in 2015, $870k in 2020, back down to about $740k at the end. Never comfortable, never actually in danger. A retirement of low-grade unease that turns out fine.
Across all ninety-eight: the median leaves $1.7 million behind, the bottom tenth around $350k, the top tenth $3.7 million. Five run out (1964 through 1968, all neighbors, all the 1966 story), and every one fails in the last five years of the thirty.
| Marker | Ending balance |
|---|---|
| Failing start years (1964–68), 5 of 98 | $0 |
| Bottom tenth | ≈$350k |
| Retire 1929 | $690k |
| Retire 2000 | ≈$740k |
| Median | $1.7M |
| Top tenth | $3.7M |
| Retire 1982 | $5.8M |
The household did nothing differently in any of these. It didn’t panic-sell, it didn’t get greedy, it didn’t skip a rebalance. The one input that varied was the year on the calendar when it stopped working, and that one input spanned the entire distance from ruin to a fortune.
This is what “sequence risk” actually means#
Every retirement calculator mentions sequence-of-returns risk. Most of them then model it as volatility (random good and bad years), which quietly turns it into something averages can tame. The point is that returns arrive in an order, you can’t choose the order, and the order in the first decade of withdrawals matters more than the average over all thirty.
Look at the failures. The 1929 retiree, who ate a 90% stock crash across the first three years, is fine, because the crash came with deflation: $40k of spending got cheaper, bonds held their real value, and the portfolio only had to survive a few terrible years before a long recovery. The 1966 retiree ate no crash at all. What they got instead was fourteen years of stocks going nowhere while inflation ran 5, 7, 11, 13 percent, so the “$40k” they were withdrawing was $100k in nominal terms by the end, from a portfolio that hadn’t grown. There was no year in which anything dramatic happened. There was just a slow, unremarkable, unrecoverable grind, and by the time it stopped (1982, the year the luckiest retiree in the dataset was just getting started) the money that would have compounded through the greatest bull market in history had already been spent on groceries.
Two retirees, sixteen years apart, identical in every decision, one broke and one rich. Following the same good plan, they got those outcomes; each could have done better by deviating, but the right deviations were opposites (the 1966 retiree needed to cut spending early and hard, the 1982 retiree could have spent freely from day one), and nothing in the plan, or in the world of 1966 or 1982, told them which retiree they were. That’s the risk. Not “markets go down.” Your retirement date is a lottery ticket and you draw it once.
The uncomfortable corollaries#
Terminal wealth is mostly luck. The 1982 retiree was not smarter than the 1966 retiree. If you die with a large pile, that is overwhelmingly a statement about your start year, not your skill, and it means you probably worked years you didn’t need to. That’s the argument for an “enough” ratchet in the plan: once the portfolio is far enough ahead of the plan, stop trying to get richer.
Ruin is mostly luck too, but which years ruin you is not. The textbook household fails in 1964–68. A more aggressive household (earlier retirement, higher spending) fails in a wider band around the same years plus a few others; a bond-heavier one fails the same inflation years harder. The identity of the killer cohorts is a property of your plan, and it’s discoverable: the simulator lists the failing start years for every plan it runs. Once you know your failure family, you know what you’re actually insuring against, and it’s very often not the thing the advice industry is selling insurance for. (Cash buckets and bond tents insure against 1929. That was never the problem.)
| Plan variant | Failing start years | Count | Success |
|---|---|---|---|
| textbook: 60/40, 4% spending | 1964–68 | 5 of 98 | 94.9% |
| bond-heavier: 40/60, 4% spending | 1961–68 | 8 of 98 | 91.8% |
| higher spending: 60/40, 5% | 1928–29, 1936, 1956, 1959–73, 1999–2000 | 21 of 98 | 78.6% |
“Average return” is a number nobody experiences. The average-return projection every planner uses is the mean across exactly this fan. It’s a fine description of the 1943 retiree (the median line) and a lie for everyone else. The failing cohorts are precisely the ones where the average doesn’t show up on time. A plan is not “does the average work”; it’s “how many of the ninety-eight lines stay above zero,” and the answer changes with every input you touch.
Success rate is a count of years, not a probability. 95% here means five start years out of ninety-eight, all adjacent, all the same story. That’s the resolution of the instrument: one percentage point is one flipped cohort. Nobody should optimize a retirement plan to a decimal, and anyone reporting 94.6% vs 95.1% as a difference is reporting noise.
What you can actually do about a lottery#
You can’t pick the ticket. You can change the fan.
Every experiment I’ve run on my own plan was, in retrospect, this: find the cohorts that break the plan, and shift the shape of the distribution so those lines stay above zero, even at the cost of the top of the fan. For my plan the failing family was the inflation cohorts, so the fix was an asset that holds real value through a decade of inflation, held only in the window around the retirement date where the sequence matters. It happened to raise the median too, but that’s not why it won: it cut off the zero tail. That’s the trade you want, even when it isn’t free.
The other lever is spending flexibility, and it’s real but smaller than the many YouTube videos suggest: a livable guardrail (cut spending modestly when the portfolio falls behind) rescues a cohort or two at the edge of the failure family. What it can’t do is rescue a plan whose allocation is wrong for its failure years; no depth of belt-tightening turns 1966 into 1982.
And the third is time, meaning working longer. Each extra working year adds savings, removes a year of withdrawals, and lifts every line in the fan. But its value has a cliff: while some start years still fail, one more year can erase whole failure cohorts; once every start year survives, another year of work buys no safety at all, just a bigger pile.
The one chart#
If you take one thing from this series, make it the fan chart: your plan, run once per historical start year, one line each. Not the average. Not a percentile band from random draws. The actual ninety-odd lives your plan would have lived, side by side, so you can see with your own eyes that the same choices land everywhere from zero to five times what you started with, and then ask, calmly, which of those lines you’re willing to accept, and what would move the bottom ones.