Work from 2001 to 2018 · Part 8 of 12
Buy Side, Sell Side, Same Data
Two PrecisionDemand dashboards asked opposite questions of the same TV ad data. One of them turned a 20% time idea into a granted patent.
On this page
When I built the portfolio I froze in 2018, two of the cards on it were almost the same picture. Both were dashboards full of bars and bubbles, built from the same pile of scripts, running on the same TV ad data. The card copy is what separated them. One asked how well an industry was buying its airtime. The other asked, of one hour-long block of airtime on one station, which industry should be buying it.
That second question is one of the three things in this portfolio I’m proudest of having asked. It started as a 20% time idea, ended up in front of real customers, and eventually became a granted patent with my name on it. The first one isn’t the warm-up act, though. Industry Ratings had real customers, and eight years later it’s still the more fun of the two to sit down and use.
The transaction has two sides#
A TV ad buy is a transaction, and every transaction can be looked at from either end of it.
The advertiser (or more usually its agency) is on the buy side. It has a product, a budget, and an idea of who should be watching. Its question is: across all the airtime I bought last year, how well did I actually reach those people, and did I overpay for the privilege?
The network is on the sell side. It has inventory: a specific station, on a specific day, in a specific hour, running a specific program, with a specific audience sitting in front of it. Its question is the mirror image: given this one slot, which advertiser’s audience does it fit best, and what should I be charging them for it?
The data underneath is identical. Airings, audiences, prices. What flips is which side of the join you hold still.
Two dashboards came out of that, IndustryRankings and sellSide. They shared the same chart
library, a folder of scripts all prefixed pd, for PrecisionDemand, where I was the sole UI
developer from 2010 until AOL acquired us in 2014. Everything on either screen is mine, design and
code.
Two numbers to read the screens with#
Every bar on both dashboards is a function of two numbers, so here they are up front.
The first is a targeting score, a stat of ours that correlated the audience the advertiser wants with the audience the media actually delivered. Positive means the buy leans toward the right people, zero means it’s effectively random, and negative means it leans the wrong way. The example in our own help text was senior life insurance advertised on Cartoon Network. It was comparable across industries, which is what makes a leaderboard of unrelated industries a sane thing to draw at all.
Around it sat two prices. CPM is cost per thousand impressions, standardized to a thirty-second spot, and tCPM divides it by the targeting score: the price of a thousand usefully targeted impressions, lower is better. Costs came from SQAD clearing rates, impressions from Nielsen, the targeting from our own modelling.
Buy side: how well is your industry buying?#
IndustryRankings shipped under the name PD Industry Ratings (the navbar brand next to it
says PD Industry Ranking, singular, and nobody ever reconciled the two). Its headline was a
question posed directly to whoever was looking at it: How well do the top agencies reach their
target audience?
 Load the real 2013 demo (about 7 MB of data)Hide the demo
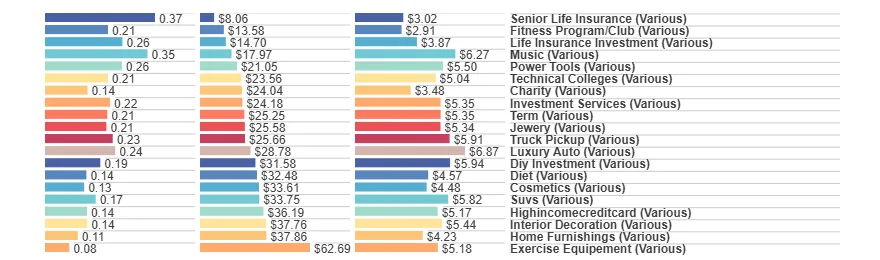
The top band is three horizontal bar charts sharing a single column of labels: targeting score, tCPM, CPM, one row per industry. It reads like a leaderboard, but note the sort: the rows are ordered by tCPM ascending, cheapest useful impressions first, and the score bars are left to fall where they may. That was deliberate. The industry with the best targeting isn’t the industry getting the best deal, and putting the two next to each other in tCPM order makes the mismatch impossible to miss. Senior Life Insurance sits at the top with a score of 0.37 and a tCPM of $8.06. Music, three rows down, has almost as good a score at 0.35 and pays more than twice as much for it.
Below the bars, two bubble charts do the same job geometrically: targeted impressions against spend, and targeting score against tCPM, with bubble radius carrying a third variable. The help text told you where to look (bottom and to the right is most efficient), and the bubbles that sat away from the diagonal were the conversation.
Down the left rail are six histograms (score, tCPM, CPM, Spend, Impressions, tImps), and every one of them is a filter. Click a bar, or drag across a range of them, and the whole page recomputes. There’s a dataset menu in the navbar with twenty industries in it plus a TV-overall set, so you could either compare everyone or go and live inside one vertical.
And then across the bottom, the thing this whole post exists to show you: a strip of impressions along the footer with a brush on it. Every dashboard I built in this era had one. Drag a window across the time axis and everything above refilters: instantly, no submit button, no page load. I think of it as the sweep, and it’s the single interaction I’d demo first if you gave me one minute.
Load the demo above and drag the brush from 19 January to 10 November 2011: same page, same dataset, one gesture later. The interesting part is what does not stay put:
| Full range (May 2010 to Feb 2013) | Swept (Jan to Nov 2011) | |
|---|---|---|
| Top row | Senior Life Insurance, tCPM $8.06 | Senior Life Insurance, tCPM $7.40 |
| Term | 9th, score 0.21, tCPM $25.25 | 3rd, score 0.25, tCPM $20.46 |
| Life Insurance Investment | 3rd | 19th, and no bars at all |
| Spend axis | $0 to $250MM | $0 to $70MM |
The detail the table can’t carry is that Term’s targeting improves inside the window rather than merely getting cheaper, and that Life Insurance Investment and Exercise Equipement (spelled the way the product spells it) keep their labels but lose their bars entirely, because inside those ten months they have no qualifying airings at all. None of it is a page load: it’s the same crossfilter-and-dc.js machinery from the previous post doing set arithmetic under your cursor, and it’s the reason a static screenshot of any of this work undersells it so badly.
Sell side: one slot, twenty-three answers#
Now turn the question around.
 Load the real 2013 demo (about 7 MB of data)Hide the demo
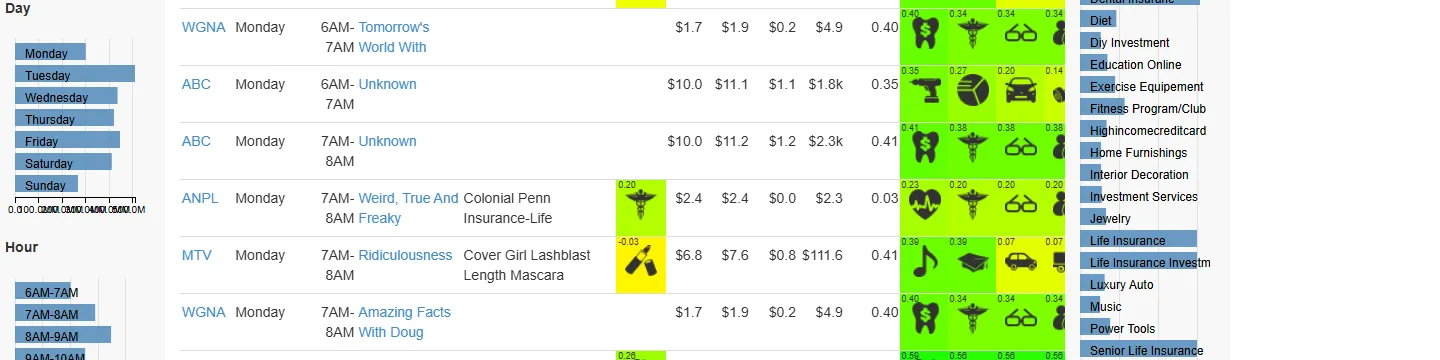
The header says 15,502 selected out of 15,502 records, which is crossfilter’s row count and the
first thing that changes when you touch anything. Down the left are Station, Day and Hour. Down the
right are the metrics: industry, targeting score and its delta, tCPM, Optimal CPM, CPM Delta, CPM Delta %,
Impressions, every one of them a filter, plus a Sort Cards by toggle that flips the ranked cards
between alphabetical and score order.
The middle is the actual invention. Each row is one airing, and it starts with the facts: station,
day, hour, program, the brand currently in that slot and its industry. Then the money: current CPM,
optimal CPM, the delta between them, the revenue delta, the targeting-score delta. Then twenty-three columns
headed 1st through 23rd.
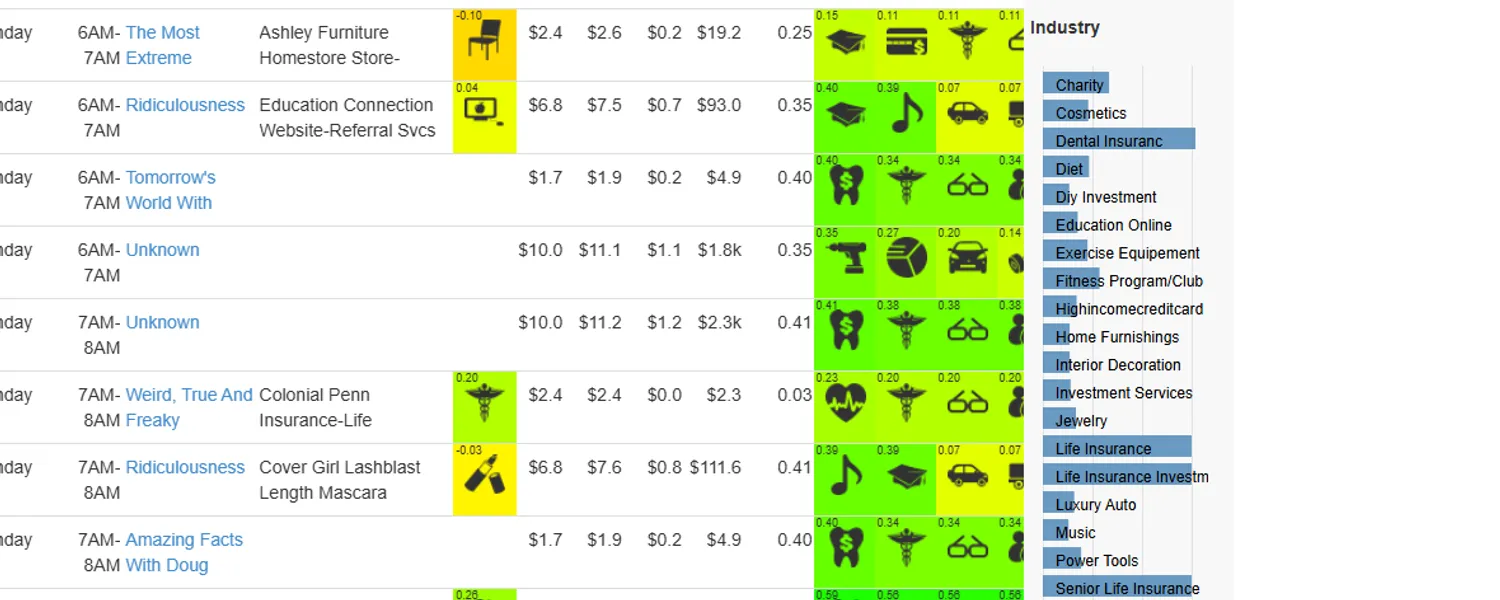
Those columns are the answer. For that one airing, all twenty-three industries in the model are scored on how well their target audience matches the people actually watching, and the columns hold them in ranked order: a pictogram for the industry, its fit score above it, and a background shaded from yellow up to bright green by how good the fit is. Reading one row left to right, you get: here is what’s in this slot now, here is what it costs, here is what it could cost, and here in order are the twenty-three industries who should be bidding for it.
Take the row for Ridiculousness on MTV, Monday 7am. It’s currently running a mascara ad, and the
Cur Indy cell scores that industry’s fit at $-0.03, effectively worse than random for this
audience. The two best-fitting industries score 0.39, the third and fourth drop off a cliff to 0.07,
and the delta column puts the gap at 0.41. Meanwhile the slot clears at $6.80 CPM against a
modelled optimum of $7.60.
There are exactly two industries worth phoning about this slot, the mascara currently in it isn’t one of them, and the network is under-charging for it anyway.
Fifteen thousand rows of that is not a report. It is a worklist. And because it’s crossfilter underneath, a salesperson could click their own station, drag the score-delta histogram to just the slots where the gap was largest, and be looking at their next twenty phone calls in a couple of seconds.
Twenty percent time, and then a patent#
Nobody asked for this one. It came out of the time the company let us spend on our own ideas, and it had the most obvious commercial edge of anything I built that way, because it was the only one aimed at the side of the transaction that actually owns the inventory.
It got built, it got in front of customers, and then it got written up. The application was filed on 4 August 2015 as US 14/817,990, Systems and Methods for Sell-Side TV Ad Optimization. It granted on 18 February 2020 as US10567820B2, with me as a co-inventor, nearly two years after I’d left the company, which is a very normal and very anticlimactic way for a patent to arrive.
What still runs, eight years on#
Both pages are static files, and I can still open both of them today. There’s no build step and
never was; sellSide doesn’t even have a project file. IndustryRankings is funnier: it ships
with a .csproj, a Web.config, and a bin/ folder full of .NET 4.5 DLLs, and needs precisely
none of it. The page is plain HTML. Any static server will do.
What has rotted is entirely at the edges. Both pages pull jQuery over plain http:// from a CDN,
which works on a local server and fails as mixed content on anything served over HTTPS. Both
reference ../libs/, ../scripts/ and ../content/ in lowercase against folders actually named
Libs, Scripts and Content, invisible on Windows, a wall of 404s anywhere case-sensitive. The
copies embedded above are the exception: preserving them for this site meant patching exactly those
edges (a vendored jQuery, lowercased paths and filenames) and nothing else. And a handful of the
interactions are subtly buggy now in ways I didn’t notice at the time and won’t fix in 2026.